The source of the this information is Scott Roe’s book and Coffee Recent Developments.
Averages used as a guide, no one coffee sticks to these numbers:
| Item | Low % | High % | Ave | What they do |
| Sugars / Sucrose | 6.0% | 9.0% | 7.5% | becomes fructose / glucose and acetic acid |
| Lipids | 15.5% | 16.5% | 16.0% | Retain aroma and produce mouth feel |
| Protiens & free amino acids | 10.0% | 13.0% | 11.5% | interact -> Maillard reations |
| Alkaloid: Caffeine | 0.9% | 1.1% | 1.0% | 10 % of the coffee’s bitterness and majority of simulant effect |
| Alkaloid: Trigonelline | 1.0% | 1.0% | 1.0% | Greatest contributor to coffee’s bitterness |
| Moisture Content | 10.5% | 11.5% | 11.0% | Higher the value slower the heat transfer |
| Organic Acids | 7.0% | 10.0% | 8.5% | Coffees acidity / sourness / astringency and bitterness (acids: cholorgenic, citric, quinic, caffeic, malic, acetic and formic acid) |
| Others | 49.0% | 38.0% | 43.5% | What is left |
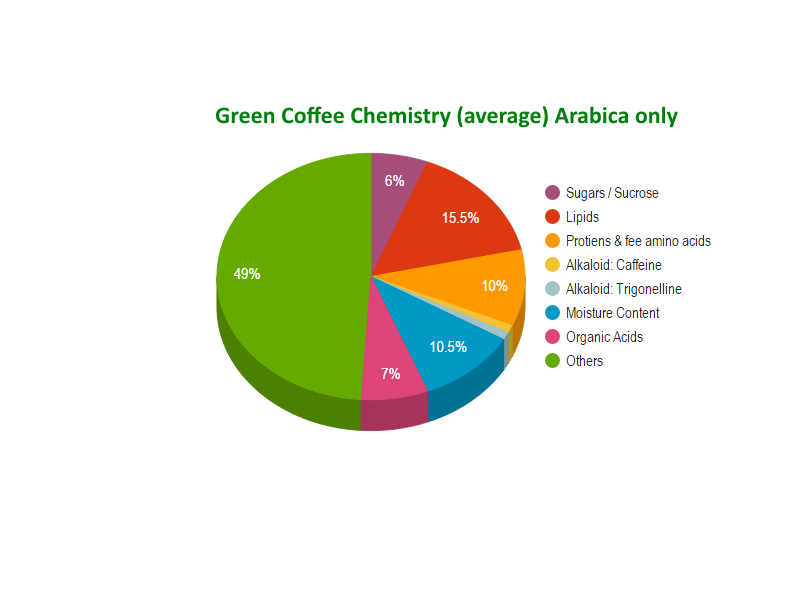
Graphically
The above table of green coffee chemistry is represented on a pie graph